We judge the performance of our economy, first of all, by its ability to generate a rising level of real income for the American people. Figure 30.1 reveals the enormous increase in real per capita income since 1870. Although there are several large fluctuations around the trend—notably the decrease during the 1930s, and the increase in the 1940s (which is debatable because of the problems in measuring gross domestic product [GDP] in a war economy)—the long-term trend is clearly upward. We have, moreover, grown steadily: as Figure 30.1 shows, a 2 percent per year trend line fits the data extremely well. The current generation of college students is understandably worried about our economic future. As the end of the graph shows, the current recession and slow recovery have left the economy well below its long-run trend. If history is any guide, the economy will eventually pick up steam and rise to still higher levels, but that is cold comfort to a generation experiencing economic distress.
565
FIGURE 30.1 Real Gross Domestic Product Per Capita, 1870-2011
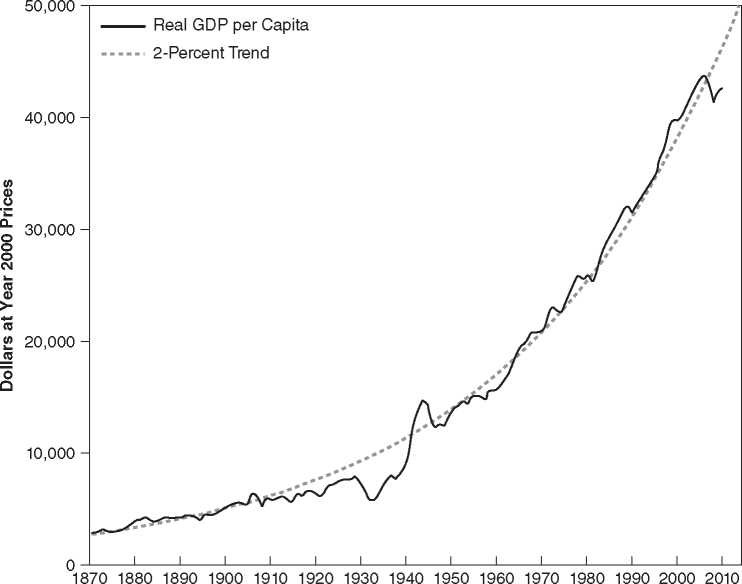
Sources: 1870-1958: Historical Statistics of the United States, Millennial Edition, series Call; 1959-2011, Economic Report of the President, various issues.
The possibility that other countries may surpass the United States economically worries many Americans. But the empirical evidence suggests that this concern may well be overblown. Table 30.1 compares the level of real per capita income in the United States with the levels in some of our closest rivals since 1980. Such comparisons are inherently fraught with difficulties. The exchange rates used to convert incomes in foreign currencies into dollars may not adjust for the true differences in prices in different countries.
TABLE 30.1 REAL GROSS DOMESTIC PRODUCT PER CAPITA-SELECTED COUNTRIES AS A PERCENTAGE OF THE UNITED STATES
|
COUNTRY |
1980 |
1990 |
2000 |
2006 |
2007 |
2008 |
2009 |
|
United States |
100% |
100% |
100% |
100% |
100% |
100% |
100% |
|
Canada |
84 |
83 |
80 |
81 |
83 |
83 |
83 |
|
France |
79 |
76 |
72 |
74 |
73 |
73 |
73 |
|
Germany |
69 |
78 |
73 |
72 |
78 |
80 |
79 |
|
Italy |
71 |
73 |
69 |
69 |
72 |
71 |
69 |
|
Japan |
67 |
87 |
79 |
73 |
72 |
72 |
71 |
|
Sweden |
78 |
75 |
70 |
80 |
85 |
85 |
83 |
|
United Kingdom |
67 |
71 |
69 |
80 |
81 |
81 |
80 |
Source: Statistical Abstract of the United States, 2009, Table 1306. 2007-2009: Statistical Abstract of the United States, 2012, Table 1349.
The income comparisons, moreover, do not take into account differences in noneconomic variables that affect the standard of living. Nevertheless, the figures in Table 30.1 are an improvement over, or at least a supplement to, anecdotal evidence based on the accounts of travelers who have visited these countries. As you can see, most other industrial nations still have lower per capita real products than the United States. A number of countries, it is true, have come closer to parity with the United States: Germany and the United Kingdom, for example. But others, such as Canada and Japan, have stayed about even with the United States. The table, it is true, excludes China, India, and other countries in the developing world that have grown much more rapidly than the United States. But these countries started far behind the United States in terms of per capita income, and are likely to grow faster while they are catching up. It is important to remember, moreover, that U. S. levels of income need not fall simply because the levels in other countries are rising. The global economy is not like a football game where when one team wins, the other loses; in the economic game, all teams can come out ahead.
 World History